

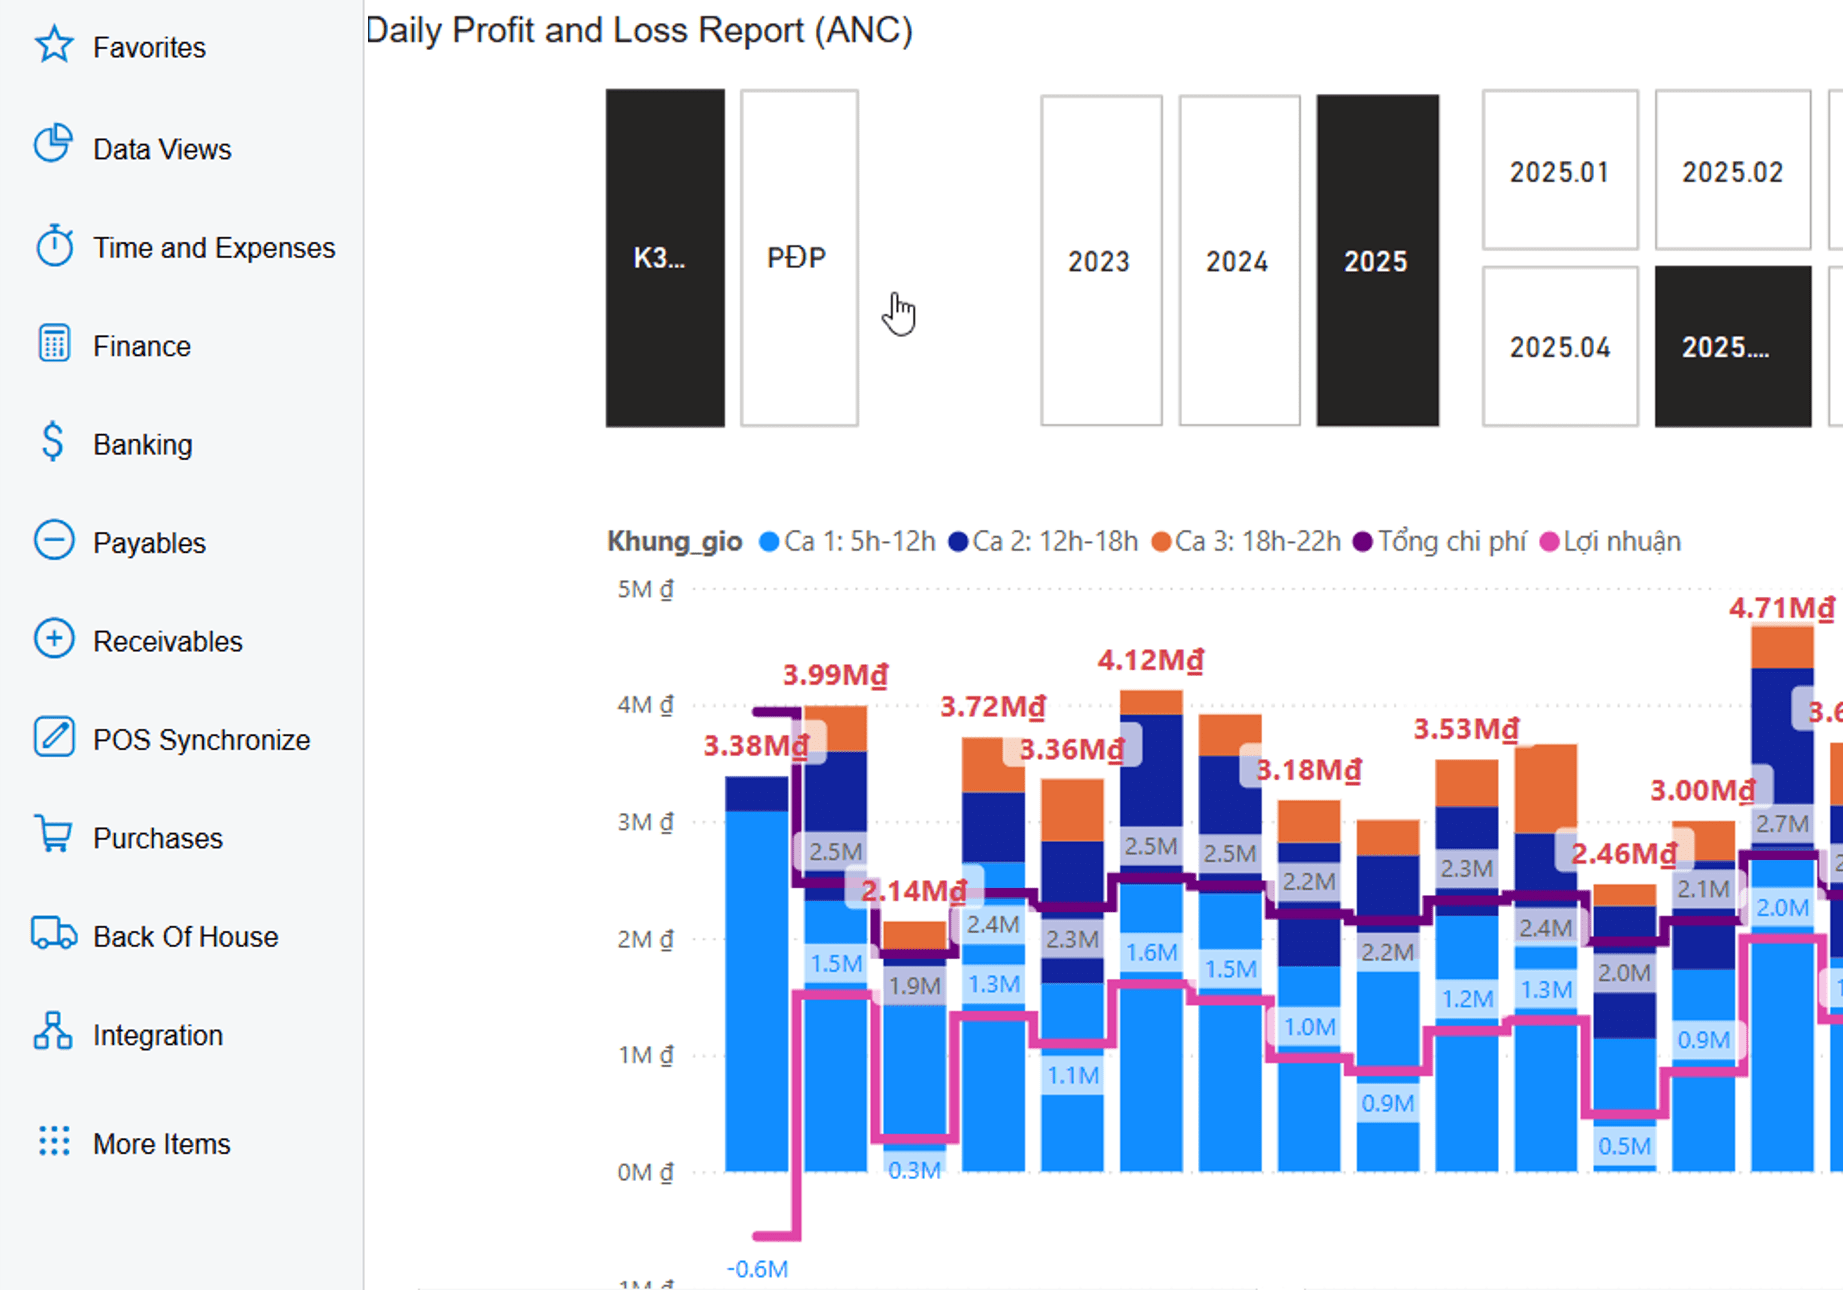
Per-store P&L, every day
Acumatica combines POS revenue, recipe-based food cost and operating expenses to calculate P&L by store, region and chain. Dashboards update continuously on desktop and mobile.
Per-location P&L is the language of leadership
Decisions to open, close, restructure or invest in a store need reliable, continuously updated P&L built on one standard for the whole chain.
Four-wall P&L
Revenue, food cost, labor and operating costs by store.
Fair comparison
Rank stores, regions and brands on the same standard.
Ask with AI
Leadership queries data in natural language through AI Assistant.
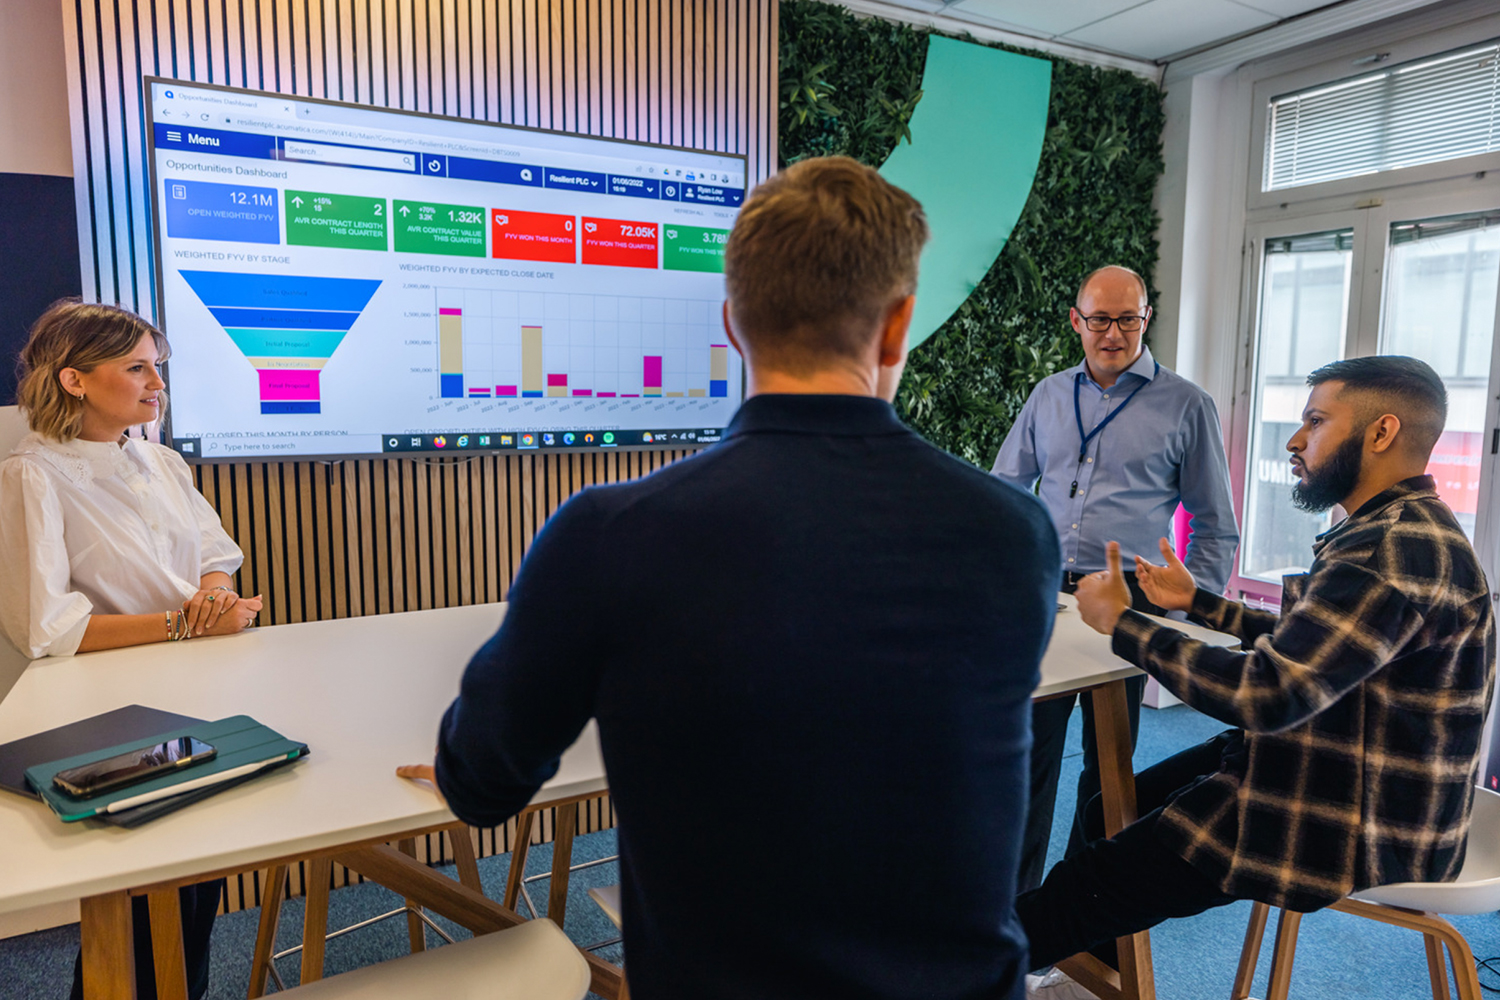


See the right numbers and profit opportunities appear
Data drives profit when leaders see it in time.
Daily P&L for every store
Revenue, food cost, expenses and profit by day and store, compared across locations.
- P&L by store, region and chain
- Store-to-store comparison
- Daily, weekly and monthly trends
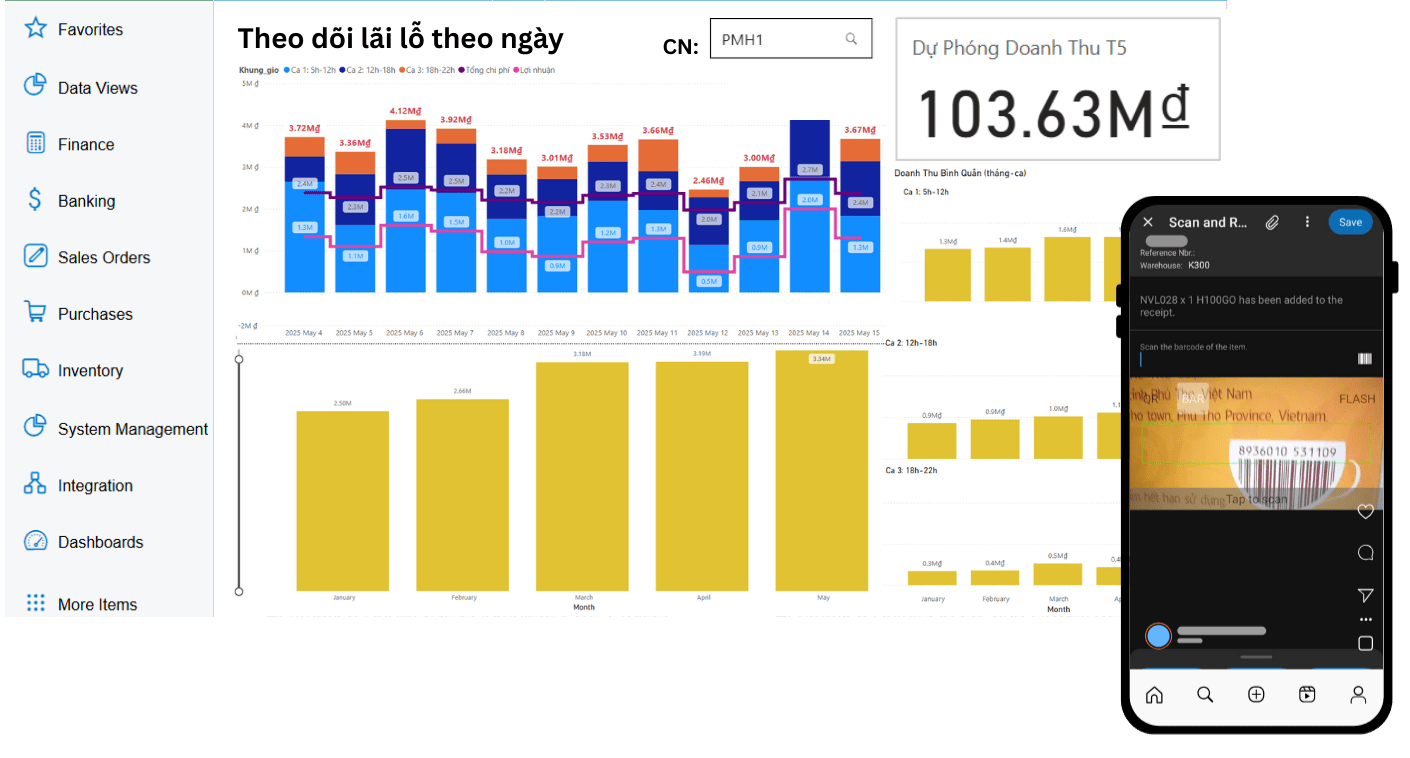
Daily revenue on your phone
Area managers and executives see daily revenue by shift on the mobile app.
- Mobile dashboards
- Revenue by shift and channel
- Fed by POS data
Operational dashboards for the chain
Widgets for revenue, food cost, stock and waste are configured by role: CEO, COO, area managers and store managers.
- Role-based dashboards
- Alerts on unusual metrics
- Drill down to source documents
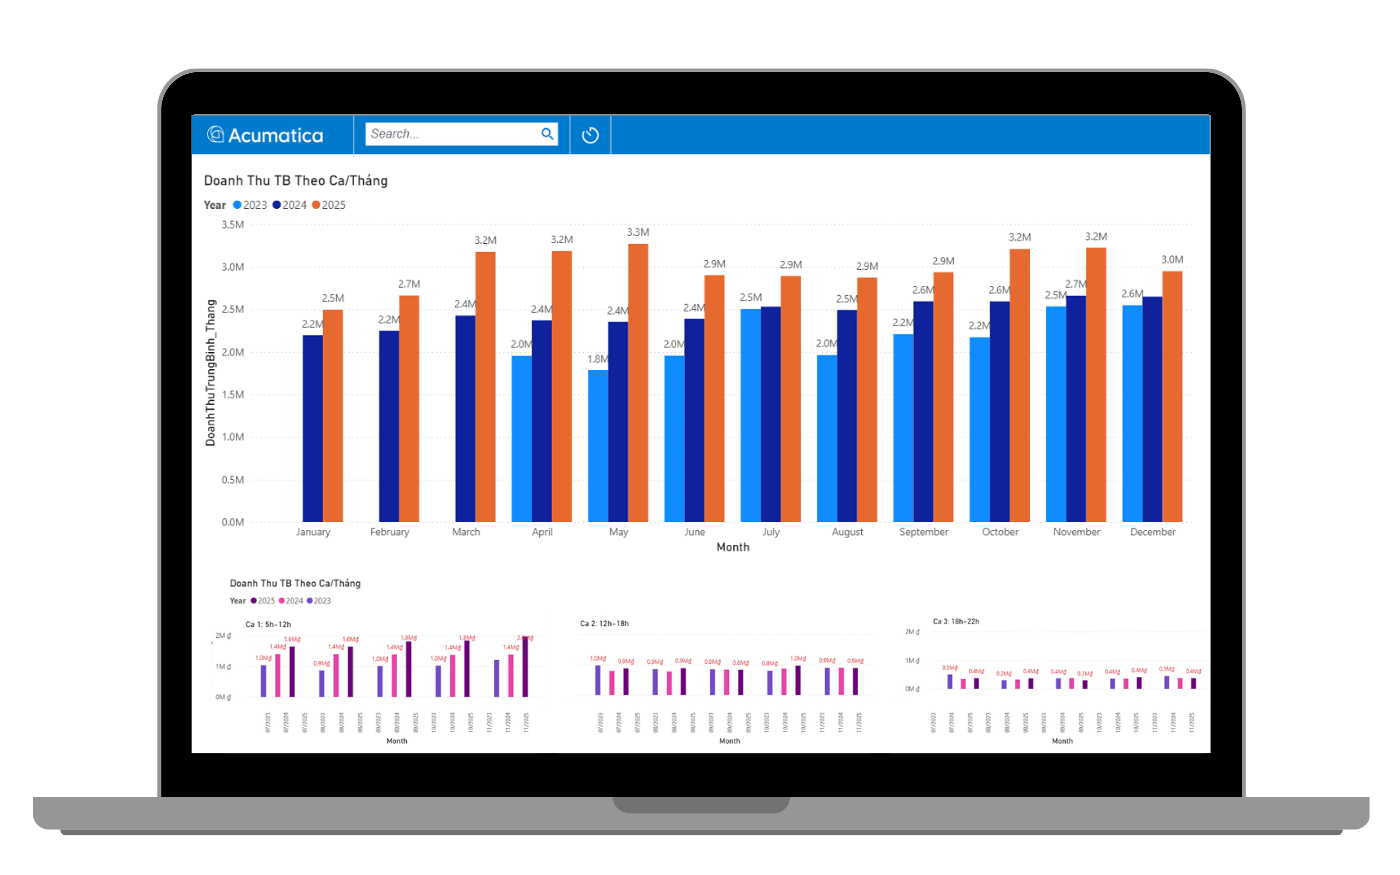
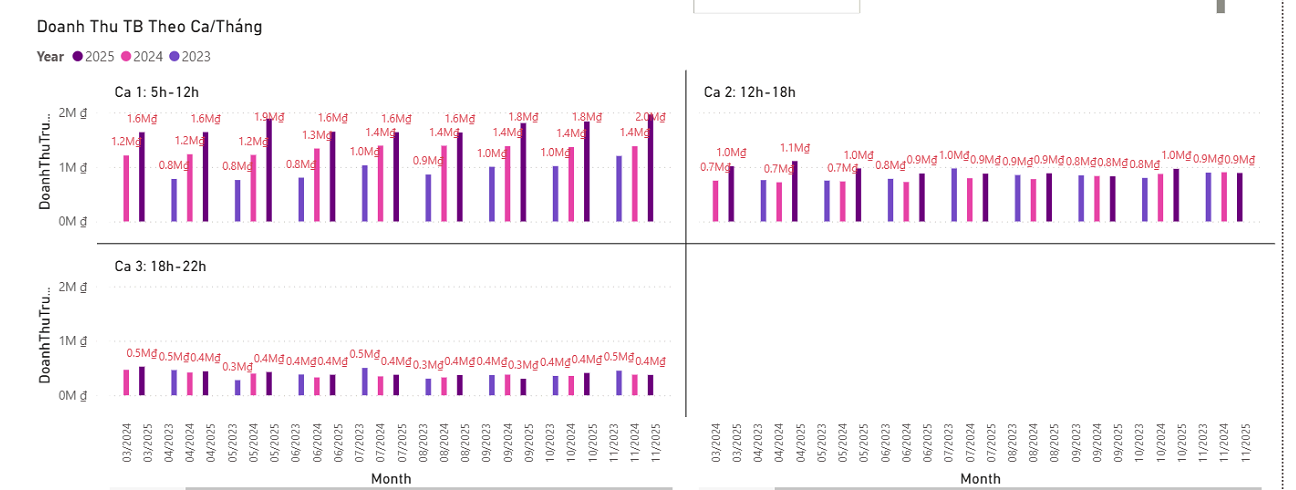
Revenue trends by shift
Shift revenue analysis helps plan staffing and flag shifts with unusual results.
- Revenue by time slot
- Shift comparison
- Supports staff scheduling
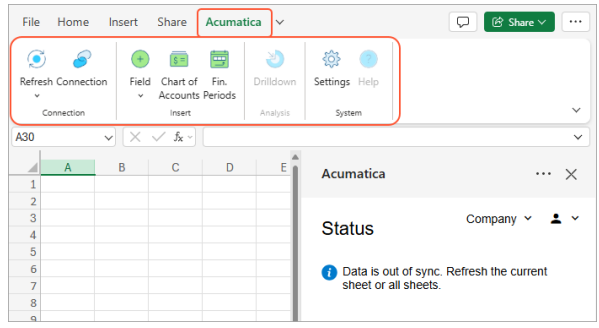
Deep analysis in Excel and Power BI
Acumatica data connects to Excel and Power BI for finance team analysis.
- Excel add-in for ERP data
- Power BI connection
- One source of truth
What Store P&L & dashboards includes
Store P&L
Daily, weekly, monthly
Regional P&L
And chain-wide
Actual food cost
From backflush and counts
Role dashboards
CEO, COO, area managers
Mobile dashboards
Numbers anywhere
Shift analysis
Time slots and channels
Drill-down
To source documents
Excel & Power BI
In-depth analysis
AI Assistant
Ask for numbers in plain language
Other features
Recipes & Backflush
Portions by item, size and topping · Deduct ingredients from POS sales
Barcode stock counts
Scan printed manufacturer codes · Phone or handheld scanner
Warehouse management
Warehouse, central kitchen, stores · With in-transit tracking
Central kitchen & MRP
Semi-finished goods in the kitchen · Production and purchase suggestions
Purchasing & suppliers
From stores and central kitchen · Agreed prices by supplier
Financials & multi-company
Multi-dimensional by store, region · Transaction reconciliation
Budgeting & cost control
Revenue and expenses · Variances by store
POS integration
Pre-integrated with Acumatica · n8n integration workflows
Zalo notifications
Triggered from Acumatica · No waiting on email
Shift & part-time payroll
Day, night, holidays · Social, health, unemployment
Vietnamese interface
Main business screens · Vietnamese or English
See it in Acumatica
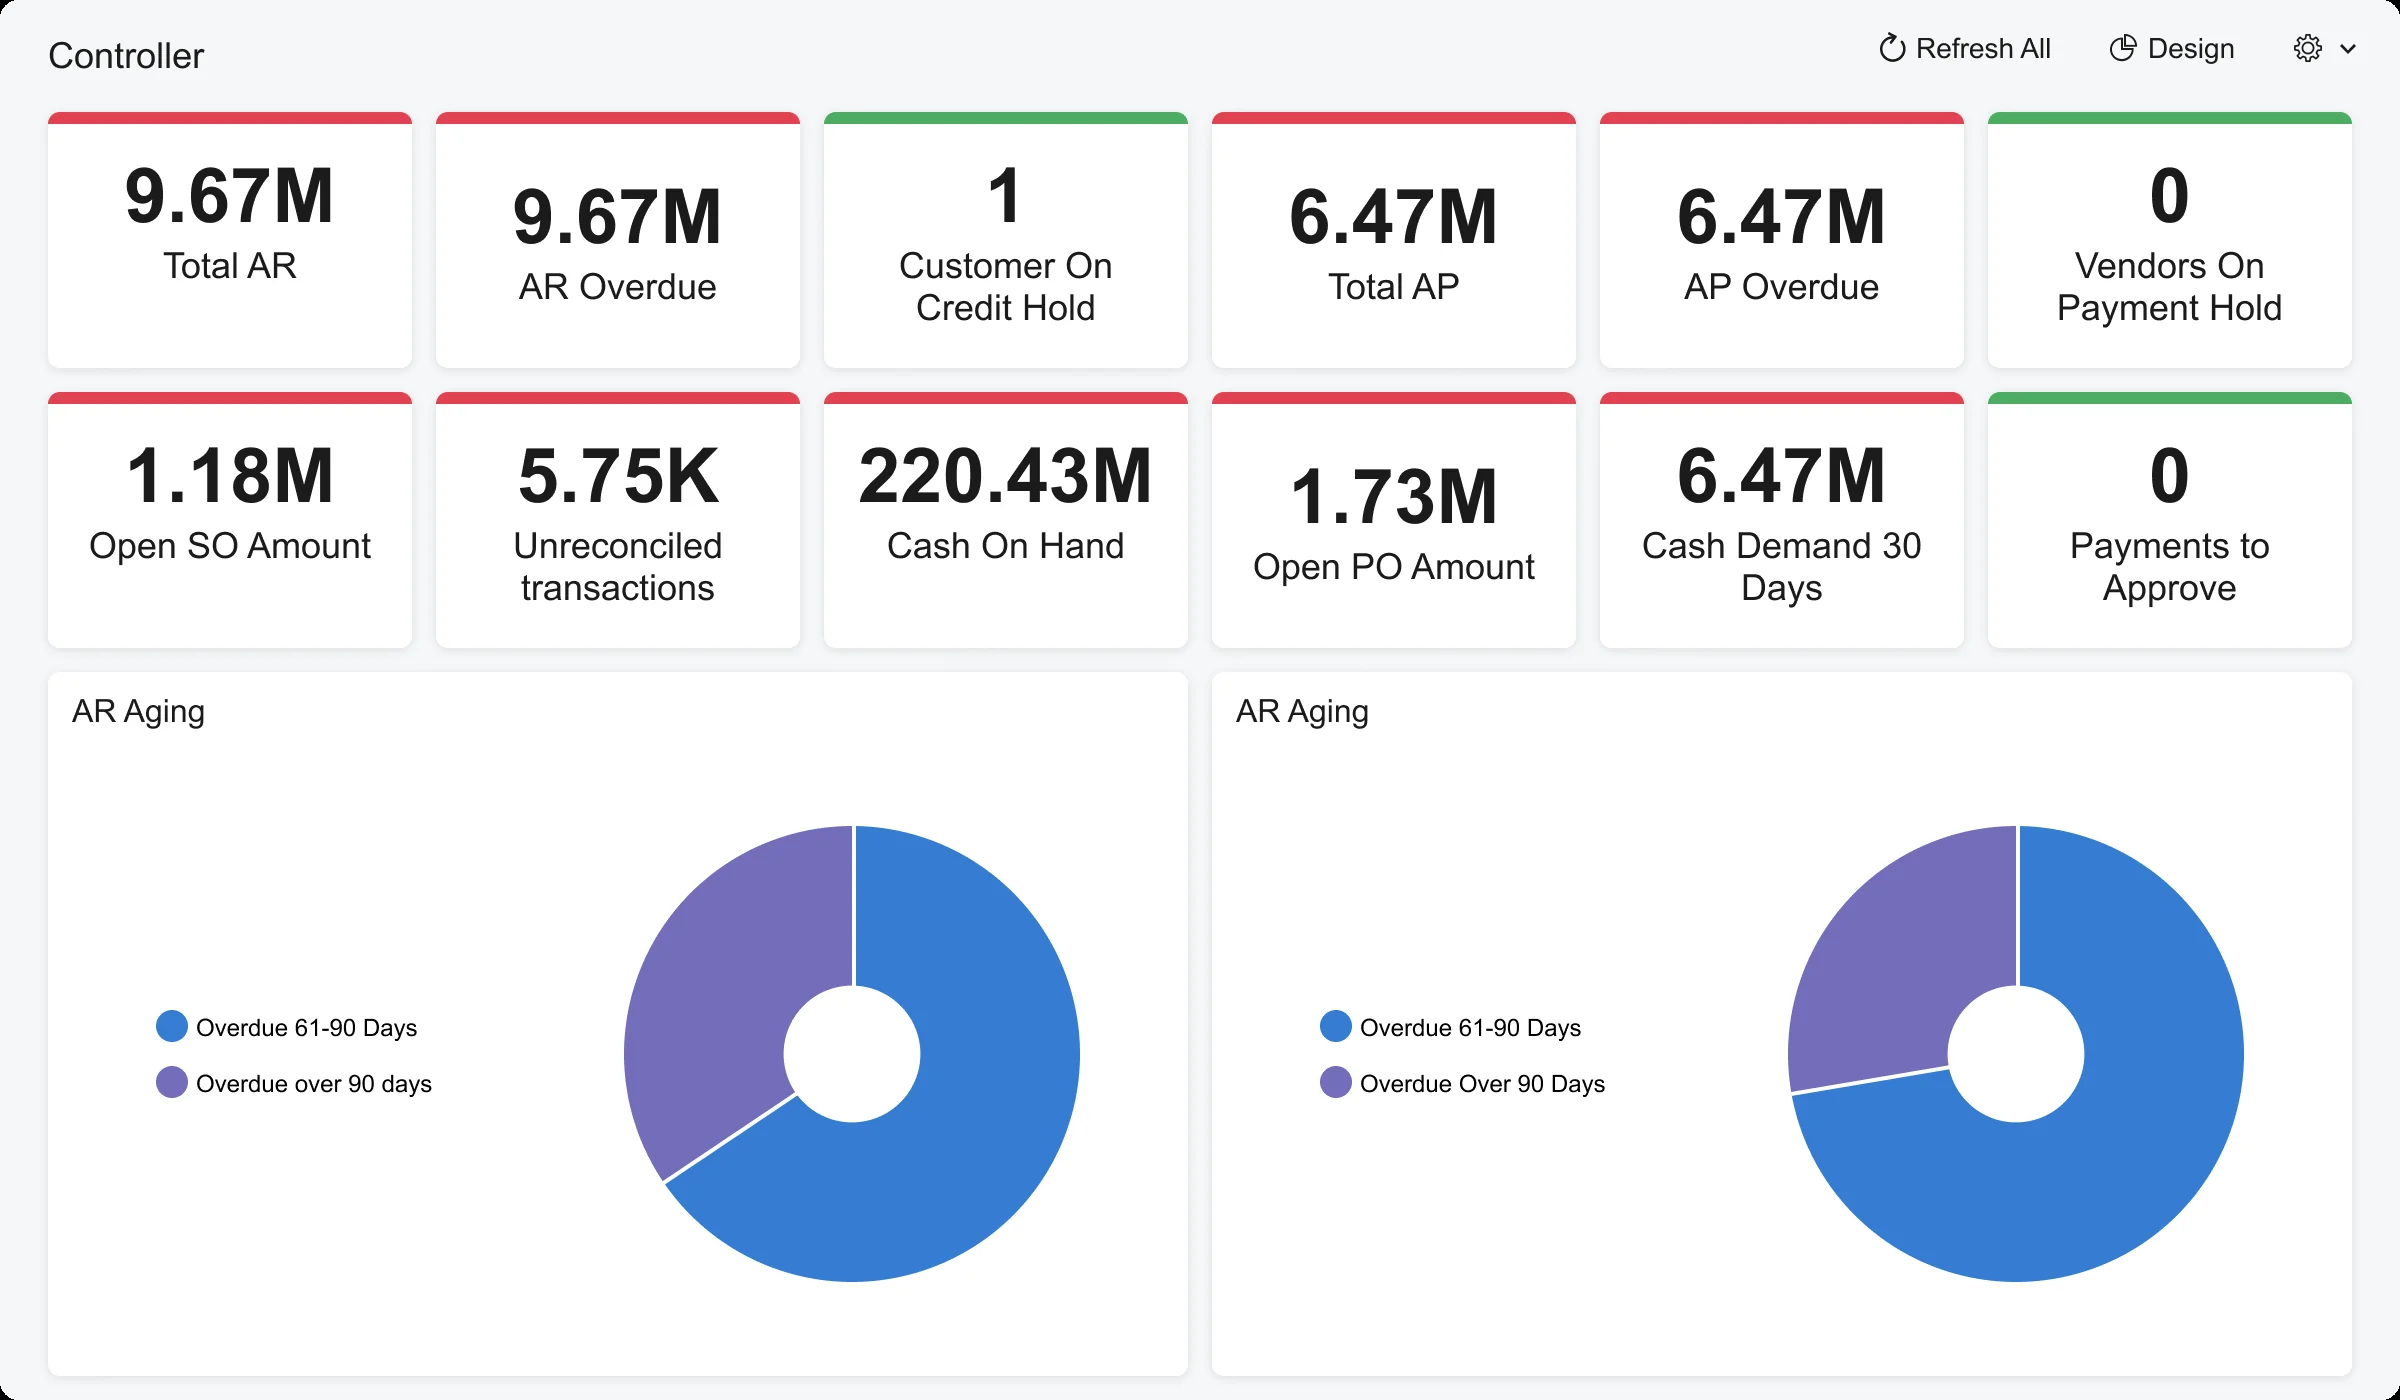
Acumatica screenshots with demo data.
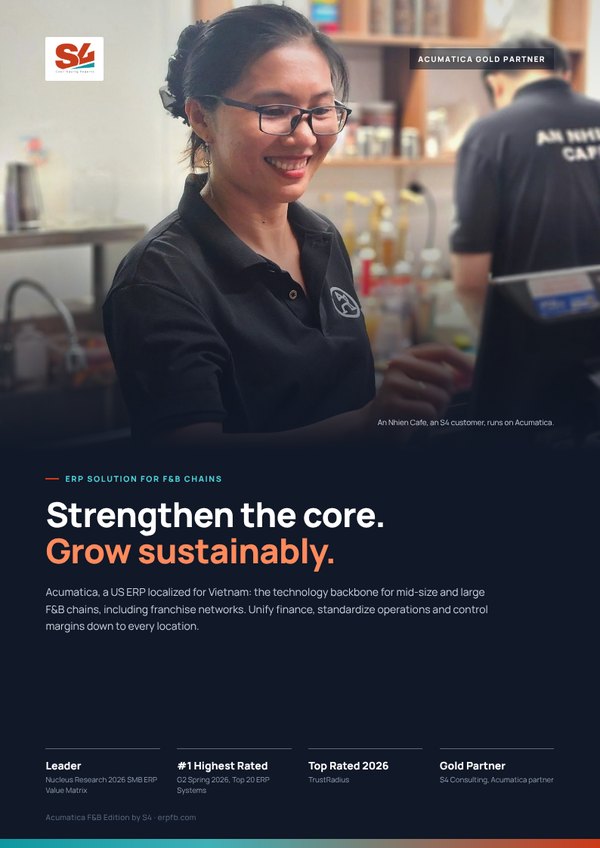
Acumatica F&B Edition by S4 brochure
Six pages for leadership: four capability layers, solutions by chain model and franchising, Vietnam compliance, the xRP platform, the An Nhien Cafe story and the Fast & Saving roadmap.
Frequently asked questions
Where does per-store P&L come from?
Can we see it on a phone?
Do we need Power BI?

 Gold Partner
Evaluate against your operating model
Book an Executive Briefing with Lac Pham or Nu Huynh to discuss goals, scope and the right rollout roadmap for your chain.